Category Archives: Solar Cycle 25

NOAA Says Solar Cycle 25 Sunspots “Skyrocketed” in January


When Solar Cycle 25 activity is view versus the forecasted path and comparison to that of SC 24’s actual path seems to provide somewhat different conclusions.

The comparison of SC 24 and SC 25 when viewed at the same amount of time after the cycles started make them look like they are on the same track. Look at about 30 to 31 months after cycle start, the green line (SC 25) and the brown line (SC24) essentially at the same place. Graph curtsey of Solen.com

NOAAs Spaceweather has this to say about SC25’s activity.

SUNSPOT COUNTS HIT A 9-YEAR HIGHIn a continued sign of strength for Solar Cycle 25, sunspot counts just hit a 9-year high. This plot from NOAA shows how the monthly sunspot number skyrocketed in January 2023.”

Spaceweather‘s take is versus the official forecast chart, so that doesn’t mean much at any point in time except for the end point.   The first chart shows only the smoothed sunspot number.  

The Spaceweather chart goes beyond the smoothed sunspot numbers with the December and January raw numbers going up rapidly. SC last roughly 11 years. On the Spaceweather chart, it shows SC 24 sunspots jumped in 2012 which is 11 years ago.

We will have to wait to see if the numbers in the coming months continue the upward trend.

cbdakota

Solar Cycle 25 Up-Date


SOLAR CYCLE 25 UP-DATE

The comparison of Solar Cycle (SC)25 to its predecessor SC 24 currently indicates that there is little difference in activity at the same point in time after they began.  Looking at the chart below, the two bottom lines, are SC 24 and 25.  Several months ago, SC 25 was more active than SC 24 and that lead to the thought it would be much more active than SC24.  The expert forecasts mostly said that they would be much the same.   At this point, the forecasts of similarity appear to be accurate

Chart is from http://www.solen.info/solar

The following chart shows the history of the recorded SCs.   Sunspot numbers have only been collected for recent centuries.   When a series of SCs having low numbers of sunspots occur, historically, the result is global cooling.  When a series of SCs occur with high numbers of sunspots, the result seems to be warming.  

Beginning in the early part of the last century, SCs were highly active, peaking with SC19.  SC19 has the record for most sunspots. The SCs that followed were highly active until SC 24. This period has been called a solar maximum.

The timing of the solar maximum and the increase in atmospheric CO2 are rivals for the reason that global temperatures have risen beginning in the latter part of the last century. Perhaps they both have been complicit. 

I believe that the Sun is the major factor determining global climate.  The trajectory of the SC 24 and probably SC 25 would suggest a global cooling is in the offing.  This should be a defining period.

cbdakota

Solar Cycle 25 Up-Date

Solar Cycle 25 Up-Date

Natural Causes for The Declining Global Temperature Part 1.


The global temperature anomaly, as read by the UAH satellite system, dropped in January about 0.03 C to + 0.12C.  This follows a drop of 0.25C to +0.15C in December of last year.  Since the last El Nino, when the anomaly peaked out at +0.50C in February 2020, the anomaly has dropped by 0.38C.

NOTE: We have changed the 30-year averaging period from which we compute anomalies to 1991-2020, from the old period 1981-2010. This change does not affect the temperature trends.

Dr Spencer’s note above, alerts the reader that the anomaly chart was change beginning in January 2021. I believe the scientific organization are all remaking their charts to comply with the new averaging period.   I suspect that it is to make more room above the averaging period.  

Why is the global temperature falling? Has something happened to the Green House gases?  Let us take a quick tour of the natural forces and see what part they are playing.

El Nino-Southern Oscillation

Currently the La Nina is dominating the Tropical Pacific Ocean.  NOAA published an advisory saying:

La Niña—the cool phase of the El Niño-Southern Oscillation climate pattern—was firmly in place across the tropical Pacific in December 2020. Forecasters estimate a 95% chance La Niña will last through Northern Hemisphere winter. La Niña can influence seasonal climate in the United States. Conditions so far have not looked especially La Niña-like, but winter is far from over.

El Nino -La Nina is a naturally occurring phenomena in that it has been observed much longer than the industrial era of fossil fuel C02 emissions. 
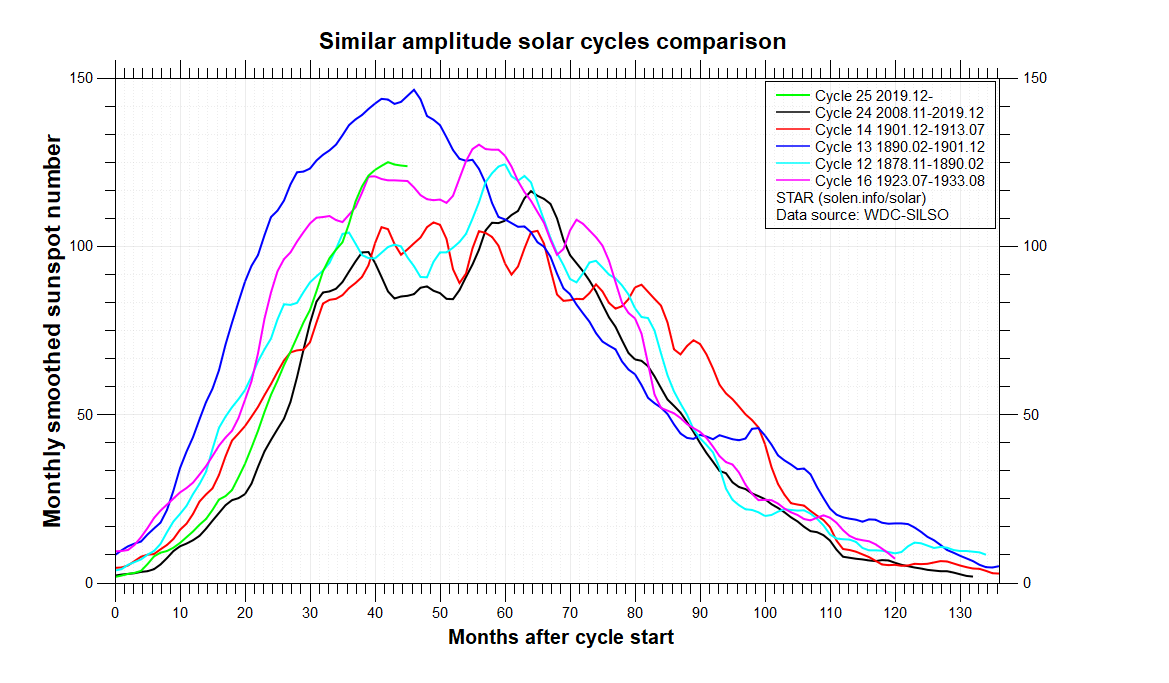
Solar Cycle 25

Solar Cycle 25 has been underway since December 2019.   The forecasts comparing SC 25 to SC24 were mostly that they would be comparable. Cycle 24 was the least active SC in 100 years. 

The more active the sun is, the more solar wind and conversely a less active sun produces less solar wind. The Sun’s magnetic field carried by the solar wind regulates the number of cosmic rays that enter the atmosphere.   The less active the sun, more cosmic rays enter the atmosphere.  Thus, low activity should form more cloud cover, thus increasing the albedo. A briefing on how this works is briefly described by a posting on GWPF titled “Force Majeure, The Sun’s role in climate control”, written by Henrik Svensmark:     

“The fundamental idea is that cosmic ray ionisation in the atmosphere is important for the formation and growth of small aerosols into CCN, which are necessary for the formation of cloud droplets and thereby clouds. Changing the number density of CCN changes the cloud microphysics, which in turn changes both the radiative properties and the lifetime of clouds.” (CNC is an acronym for Cloud Condensation Nuclei)

 This would reduce the amount of solar radiation that reaches the Earth’s surface, thus reducing global temperature.

Currently, the solar activity is at a low.

 So, where are we?

The El Nino is a natural phenomenon, that raises the global temperature, and it is usually followed by a La Nina that results in a lowering the global temperature.  We are experiencing a La Nina now.

Solar Cycle 25 in underway and it is forecast to be of low activity.  Time delays are often suggested for the impact of Solar Cycles activity.  This may be the case here and that the impact of Solar Cycle 24 is just now beginning to be felt.

Part two will look briefly at two other natural phenomena that many believe are important in effecting the global temperature.   They are the Atlantic Multidecadal Oscillation (AMO) and the Pacific Decadal Oscillation (PDO).

cbdakota

Solar Cycle 24 Ends-Solar Cycle 25 Begins


The government science agencies, NOAA and NASA determined that Solar Cycle 24 ended November 17, 2019 and Solar Cycle 25 began.  Solar Cycle 24 was the least active cycle in 100 years. There are several ways to express solar activity, but sunspot counting is the most frequently used method.  Solar Cycle 24 smoothed maximum count was 116.4 in April 2014.  The highest unsmoothed count was 146.1 in February 2014.  The smoothed count is the official number.  It is smoothed over 13 months. Six months before and six months after.  The smoothed count method is detailed at the end of this posting if you are curious.

The consensus of the experts regarding the predicted count of Cycle 25, at maximum, will be 115.  This prediction came from the Solar Cycle 25 Prediction  Panel made up international experts  according to PhysOrg posting .  In my May 2020 posting of a summary of expert’s predictions, NASA predicted that Cycle 25 would be the least active Cycle for 200 years.  NOAA however, predicted it would be more active than Solar Cycle 24.

The following chart compares Cycles 23, 24 and the predicted Cycle 25:

Some say that you can tell how active a cycle will be by the early formation of sunspots.  Lots of sunspots right away would mean an active cycle.  And conversely, slow development of sunspots would likely be the opposite. If that is true, perhaps you can make a prediction from the following chart courtesy of Solen info solar :


Virtually everything on this chart is Cycle 24.  This chart’s info box is probably very hard to read.  So let me describe the lines to you.  The dashed lines are the smoothed sunspot numbers.  The blue dashed line is the sum of the smoothed sunspots in the Northern and Southern solar polar fields. You can probably see that the blue dashed line crosses the solar max (the vertical red line) where the smoothed sunspots are at about 116.  But to make our predictions, we need to actually unsmoothed monthly sunspot reading.  That is the brown line. Here again this line is the sum of the Northern and Southern solar polar field sunspots.  In February, 2014, the monthly max of 146 was registered. Those numbers, 116 and 146, are the ones noted in the opening of this posting.

Comparing the brown line peak at 9 months after Solar Cycle 24 began, it looks like it is about a monthly 7 sunspots.  Doing the same for Cycle 25, at 9 months it looks like a monthly sunspot count of 7.  That would suggest to me that perhaps those that say 24 and 25 are going to be the same, may be right. But I would not make a bet on that.

As Yogi Berra, the Hall of Fame Baseball player, was alleged to have said, “It’s tough to make predictions, especially about the future.

cbdakota

Smoothed Count Method.

The smoothed count is a 13-month averaged sunspot count using this Belgium’s formula:
Rs= (0.5 Rm-6 + Rm-5 + Rm-4 + Rm-3 + Rm-2 + Rm-1 + Rm + Rm+1 + Rm+2 + Rm+3 + Rm+4 + Rm+5 + 0.5 Rm+6 ) / 12
Rs = smoothed monthly sunspot count
Rm = One month’s actual sunspot count
The “-6” through “+6” appended to each Rm is the number of months before or after the month whose smoothed count is being calculated. The beginning and ending months in the formula are only given half the value of the others.*

What Are The Experts Predicting For Solar Cycle 25?


The  Global Warming Policy Forum on 15 May 2020 posted   “The Sun Has Entered “Very Deep” Solar Minimum” /authored by David Whitehouse.    It provided a list of predictions of SC 25’s maximum sunspots.   I have rearranged the chart to show the predictions that suggest it will be less active than SC 24, those that expect SC24 and SC25 to be nearly identical and those that predict it will more active.

As a benchmark, SC 24 sunspots at maximum were 116.4

       Less Active

PREDICTOR SUNSPOT RANGE At Maximum
Labonville 89+29/ -14
Ahluwalia 7
Singh 89+/-9
NASA 58 to 81 (30% to 50% less than SC24)


          Nearly Identical Activity

PREDICTOR SUNSPOT RANGE At Maximum
Pishkalo 116+/-2
Komitov Same or slightly larger
Bhrowmik Same or slightly larger
NOAA 95 to 130


   More Active

PREDICTOR SUNSPOT RANGE At Maximum
Miao 121+/-32.9
Svalgaard 116.4 to 156.6
Han 228+/-40.5
Li 168+/-6.3
Dani 159+/-22.3

Continue reading

Will Solar Cycle 25 Bring On A Period of Global Warming?


I have been wondering if the very quiet Solar Cycle (SC)24 would result in a slowing down of the rise of global temperatures.  And that it might even halt the rise or perhaps even result in a downward trend.  Certainly, the prognostications by many of my compadres, the skeptics, have been for that to happen.   I look at my go-to anomaly temperature chart, the satellite measuring system know as UAH, (University of Alabama at Huntsville) and I see that the temperature continues to rise.   The Watts Up With That site’s ENSO meter (below) had not gone into the la nina area, but in fact, seems to be indicating more el nino.  However, for several months, now,

it is in the neutral zone.


Courtesy of WattsUpWithThat

And the UAH temperature anomaly has taken a significant two month drop.
Dr Spencer’s site posted “UAH Global Temperature U pdate for April 2020:+0.38 deg. C. Spencer says:

“In April, 2020, the Northern Hemisphere experienced its 2nd largest 2-month drop in temperature in the 497-month satellite record.”

The UAH temperature anomaly is shown below.

One can see the last two El Ninos on this chart.  The El Nino that peaked in 2010 followed by a La Nina brought the anomaly down to the zero line.  Then the temperature anomaly began to rise and peaked out during the 2016 -2017 El Nino. But after a drop, it turned into a rather depressing climb.

More on Solar Cycle 24.  It began in December 2008. It has been the least active SC  for over 100 years.  The SCs activity beginning with SC17 through SC 23 is unprecedented and this period is often called the “Modern Maximum”.

Sunspots are considered a proxy for solar activity. The more sunspots the more activity.  Sunspots were first recorded by Galiello  in 1610. Formal recording of sunspots began about 1750.  The naming of SCs began from that time. SC nominally are 11 years long.

So, does mean that low solar activity may not have a significant, if any effect on global temperature.  But maybe there is a time delay.   I guess we will have to wait and see.

When you look at the following chart, there is one very notable dip in the number of sunspots attributed to SC5 and 6 beginning about about 1800.  The temperatures recorded during this time dropped significantly.  For example the Thames River is said to have frozen over in the winter during that period.  This period is known as the Maunder Minimum.  Chart is courtesy of Solan In fo


SC 21, 22, 23 and 24 are plotted on the following chart.  Comparing SCs 21, 22, 23 to SC 24  makes evident the low activity of SC24.  The Chart is courtesy of Solan Info.

Because SC 24 is reasonably a match to SC5 and 6, one can see why many of our scientists considered history would repeat itself by experiencing low global temperature

This is probably the time to see what some experts are prediction for SC 25. What will SC25 turn out to be.  The next posting will provide expert solar scientist predictions for SC25’s likely activity. 


Solar Cycle 25 Predictions–National Weather Service and NASA See It Differently


While it is not unexpected that experts predicting how active Solar Cycle (SC) 25 will be compared to SC 24, the new forecast from NASA is significantly different than the National Weather Service  forecast.

A few weeks ago, I reported that the National Weather Service forecast for SC 25 activity would be slightly greater than SC 24.    They added:

“The expectation that Cycle 25 will be comparable in size to Cycle 24   means that the steady decline in solar cycle amplitude, seen from cycles 21-24, has come to an end and that there is no indication that we are currently approaching a Maunder-type minimum in solar activity.”

NASA’s prediction is different, really different.  Their expert says:

Research now underway may have found a reliable new method to predict this solar activity. The Sun’s activity rises and falls in an 11-year cycle. The forecast for the next solar cycle says it will be the weakest of the last 200 years. The maximum of this next cycle – measured in terms of sunspot number, a standard measure of solar activity level – could be 30 to 50% lower than the most recent one. The results show that the next cycle will start in 2020 and reach its maximum in 2025.

The NASA prediction did not discuss the possibility of a Maunder minimum.   However their prediction does not rule out a Maunder minimum in progress as it forecasts SC25 will not be the end of a steady decline in solar cycle amplitude.

Both of the predicting groups acknowledge that they are still far from a full understanding of how the Sun works. So, we will just have to wait and see.

cbdakota

“Solar Minimum Is Coming” Video


Solar Cycle 24 is on its way to a “minimum” .  That Minimum will probably be in late 2019 or early 2020.  The video  illustrates several issues that are newsworthy.

  • Global Temperature measurements made by satellites are often consider the “gold standard”.  Two organizations make and report their interpretation of these measurements.  The UAH and RSS organizations have typically reported very nearly the same temperatures but separation of the values occurred with RSS now giving higher readings.  A major part of the separation is based how to  correct for the drag that these satellites encounter as the circle above the Earth.
  • And a small point. When the narrator says that Cycle 24 Sunspots were “relatively high”  he is comparing the Sunspot  level now.  However, it might cause some people to think that he means as opposed to other Solar Cycles–which by and large is not true.


cbdakota

CYCLE 24 Status– June 2017


Solar Cycle 24 continues to become less active. The June 2017  International Sunspot 30 day average number was 19.4. The maximum for Solar Cycle 24 occurred April 2014 at 116.4. The following chart illustrates how the solar cycle activity has dropped off. Solar Cycle 21 was larger than 22 which was larger than 23 which was larger than the current Solar Cycle 24.

The three charts above were posted on WUWT website titled “Trends in the Revised Sunspot Number Dataset“.  From that posting comes the following analysis:

Continue reading

March Global Temperature Anomaly And Solar Cycle 24 Update


This posting combines the March global temperature anomaly and the Solar Cycle 24 stats.   Below are the UAH satellite global temperature anomalies from Dr Roy Spencer’s website. The stats below the graph show the summary since 2016 through March 2017 for the regions.


YEAR MO GLOBE NHEM. SHEM. TROPICS
2016 01 +0.54 +0.69 +0.39 +0.84
2016 02 +0.83 +1.16 +0.50 +0.98
2016 03 +0.73 +0.94 +0.52 +1.08
2016 04 +0.71 +0.85 +0.58 +0.93
2016 05 +0.54 +0.64 +0.44 +0.71
2016 06 +0.33 +0.50 +0.17 +0.37
2016 07 +0.39 +0.48 +0.29 +0.47
2016 08 +0.43 +0.55 +0.31 +0.49
2016 09 +0.44 +0.49 +0.38 +0.37
2016 10 +0.40 +0.42 +0.39 +0.46
2016 11 +0.45 +0.40 +0.50 +0.37
2016 12 +0.24 +0.18 +0.30 +0.21
2017 01 +0.30 +0.26 +0.33 +0.07
2017 02 +0.35 +0.54 +0.15 +0.05
2017 03 +0.19 +0.30 +0.07 +0.03
 

The anomaly drop of 0.16C was a substantial change.  This has been happening without a La Nina following the El Nino. 


Solar Cycle 24’s to-date April International Sunspot number is 26.6 versus March’s number of 17.7.  So, this month is a little more active but still things are quiet. Cycle 24 began in January 2008.  The mean Cycle length is 11.1 years so it should be over around January of 2019.  


As noted in previous postings the solar polar field strength following a maximum is currently a popular way to predict the following Cycle strength.  The Black line in the chart below is the line to watch. That line is the combined North and South solar polar field strength. So far it is slightly smaller than the size of Solar Cycle 23—thus using this theory, it    Cycle 25 should be about the same size as 24 or maybe just a bit smaller.  Amended for clarity on 4/20  cbdakota


cbdakota